
Drove 17% Profit Margin Growth via Conversion-Focused Pricing Strategy for Cheerleader Apparel Platform
This was accomplished by conducting a Vanwesterndorp price sensitivity analysis which uncovered not just the range of acceptable prices, but our target market’s indifference price points across all product categories
Overview
Client provided a platform for the granular customization of sports and cheer leading uniforms but all principal keywords were plagued by seasonal search volume trends. The result was a situation in which the client was struggling with undulations in traffic and revenue and wanted to understand how to cope with this development.
Problem
Their business costs (hosting, plugin subscriptions, product warehousing, taxes etc.) were going up but revenue was undulating cyclically across sharp dips and troughs leading to extreme growth constraints
Growth Audit Insights
On observing the most significant keywords in the clients industry some striking seasonality insights came into view.
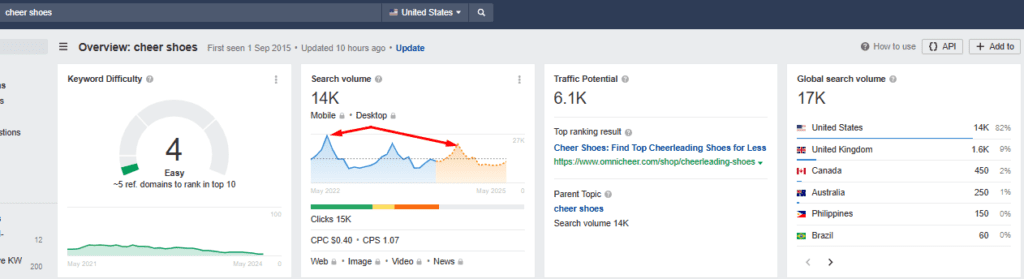
(1) Keyword: cheer shoes
Difficulty Score: 4
Search Volume: 14K
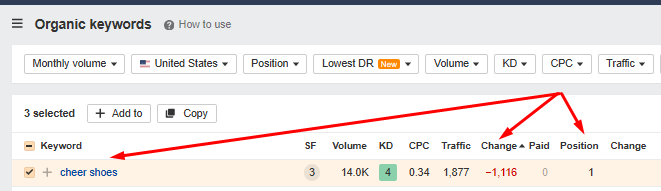
Observations: This is a keyword that the client was ranking on the first page for, however they lost over 1K in traffic despite retaining their position 1 rankings on the SERPs. This keyword was part of the larger trend of seasonality that impacts the industry and accounts for the traffic and revenue patterns the site had observed around key sporting events.
As seen in the image below, this keyword’s search activity had recorded 3 key spikes over the last 2 years (demand driving developments external to any website was likely responsible) with the volume trending downwards between April and May 2024
The same effect was observed around related keywords like
- Cheerleading Shoes (SV = 1.8K | KD = 2 | Pos = 1 | Traffic Change = -136)
- Youth Cheer Shoes (SV = 600 | KD = 2 | Pos = 1 | Traffic Change = -96)

(2) Keyword: Cheerleader Outfit
Difficulty Score: 5
Search Volume: 5.5K
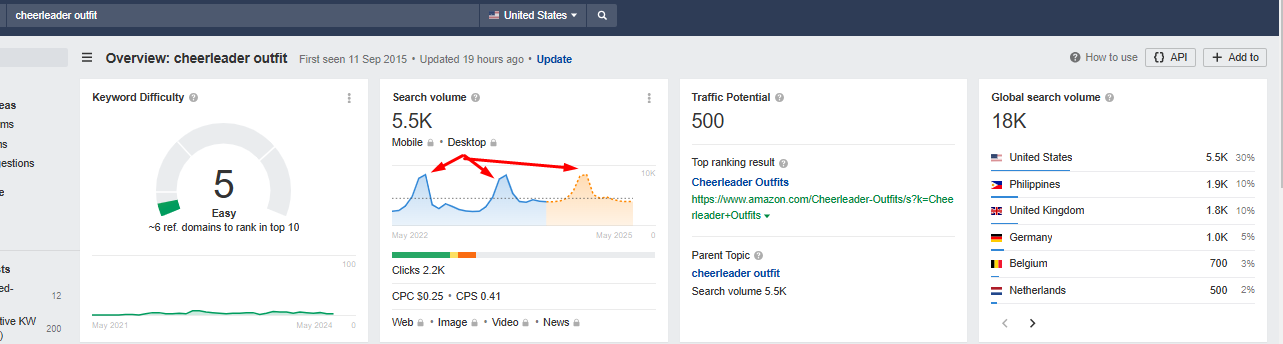
The search activity for this industry-relevant term also showed distinct troughs interjected by peaks of a smaller time duration. This indicated the inevitability of search traffic undulation regardless of the keyword position that had been captured for this term. This is because the search volume numbers swung widely from a 10K peak in october 2023 to 4.7K in April 2024 representing a 53% decline in demand as reflected in by the changes in search activity
Solution
We Initiated a research-driven pricing plan redesign which gave the client a growth advantage despite the seasonality effects associated with the major keywords in their industry. This was accomplished by first conducting a Vanwesterndorp Price Sensitivity analysis.
Across all of the client’s product categories, the goal of our analysis was to establish:
- The range of acceptable prices (RAP)
- The optimal price point (OPP)
- The indifference price point (IPP)
The analysis took the form of a survey with questions that are as follows
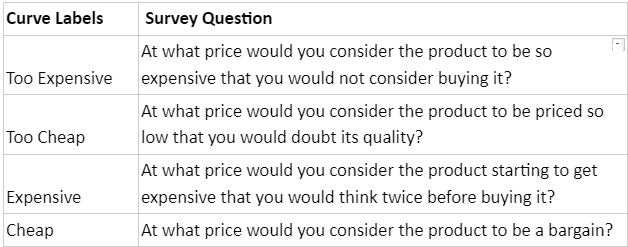
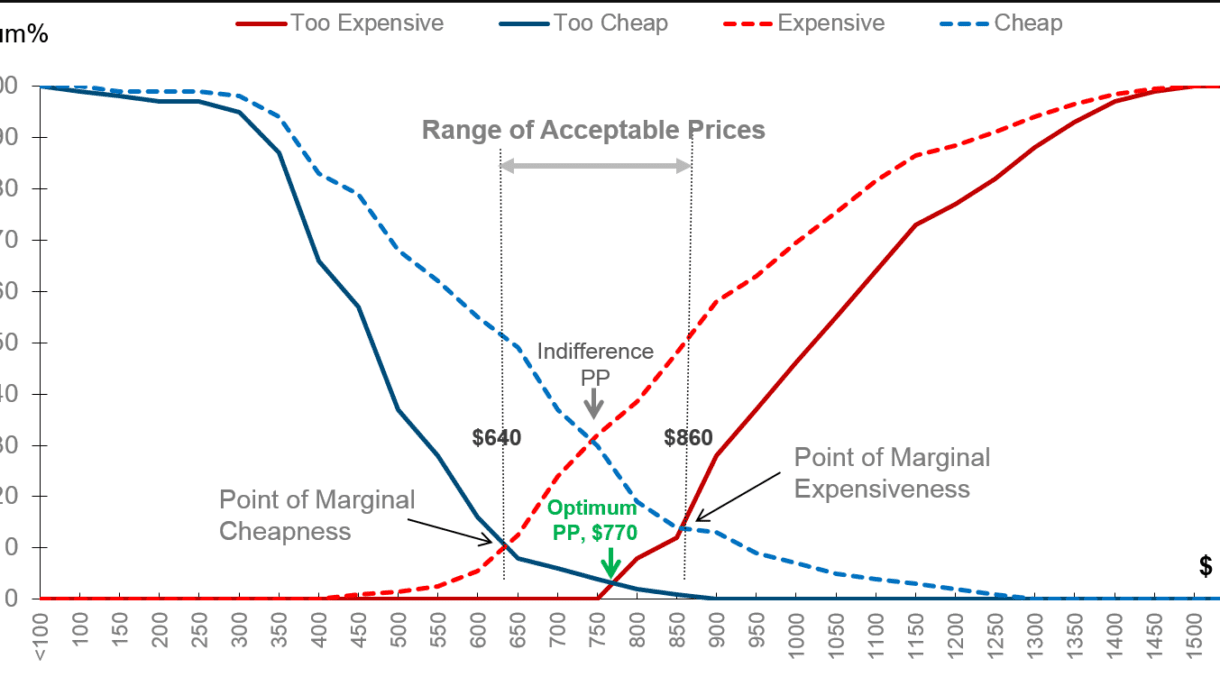
The range of answers and price points were then plotted to produce a graph like the one shown below
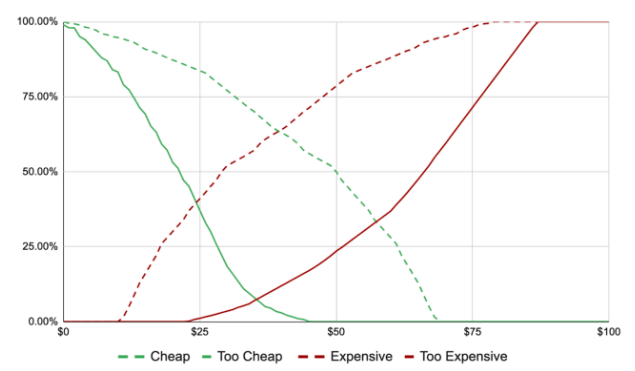
As seen in the image above, the range of pricing-related responses intersect along four points.
The intersection points of the four lines produced all key metrics (VW metrics) necessary for price setting.
See what line intersections indicated to us as we juxtaposed the graph and table below.
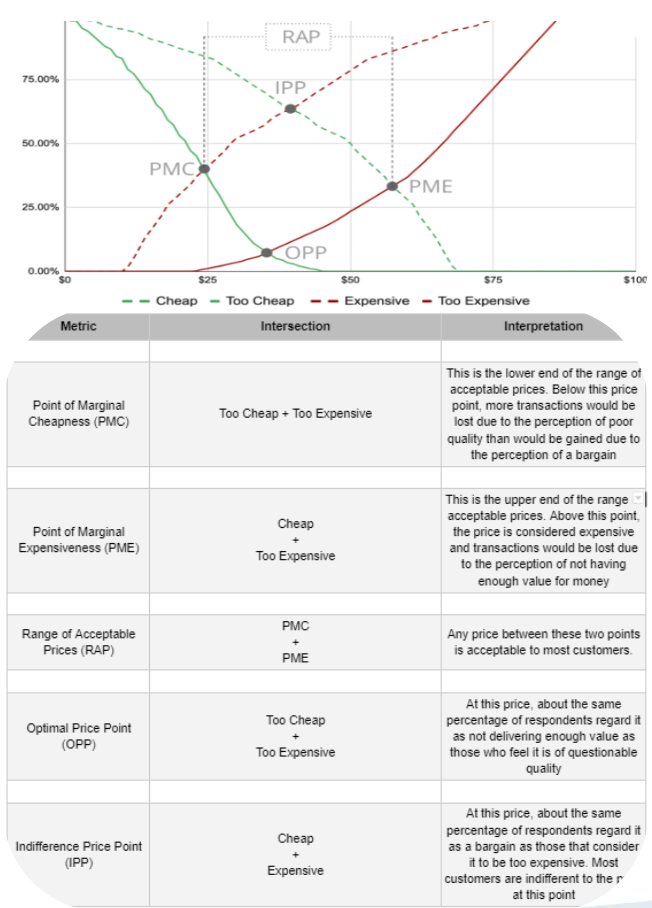
Impact
This then allowed us to price products at the IPP (Indifference price point) such that the margin between the optimal price point and the indifference price point became the client’s growth advantage and buffer across all seasonal demand undulations.