
From 3.3K to 7.48K Clicks In 120 days: 4 SEO Fixes That Transformed a Custom Planter Business
A custom planter and window box retailer faced severe Merchant Center disapprovals along with traffic and revenue drops across google shopping surfaces (both free and paid).
Through targeted technical SEO and LLM optimization—including structured data fixes, render budget optimization, keyword expansion, and crawl path enhancements—we restored Shopping eligibility, doubled organic clicks, and drove a 137% revenue increase in just four months.
Client Overview
A high-AOV ecommerce retailer specializing in window boxes and outdoor planting systems relied heavily on seasonal demand peaks in summer, with steep declines in winter. To stabilize revenue, the business pivoted toward high-value custom planter and window box solutions for architects, interior decorators, and property managers.
However, a critical mismatch in product availability between Google Merchant Center feed data, product page content, and schema markup led to large-scale disapprovals. This meant the majority of the store’s products were absent from free listings and Shopping Ads across Google, Bing, DuckDuckGo, and Qwant — severely limiting visibility.
Situation
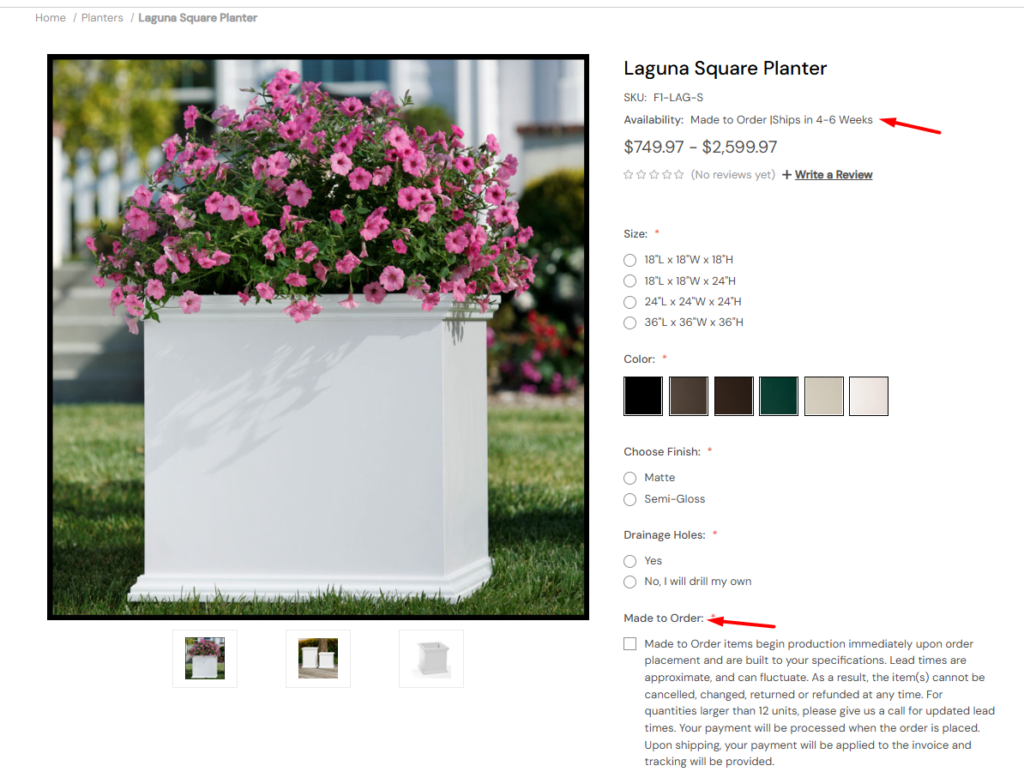
Despite a strong product offering, the site could not appear on Shopping surfaces for its custom planters because of conflicting availability statuses:
- Feed level: “In stock”
- Product page: “Made to order”
- Schema: “In stock”
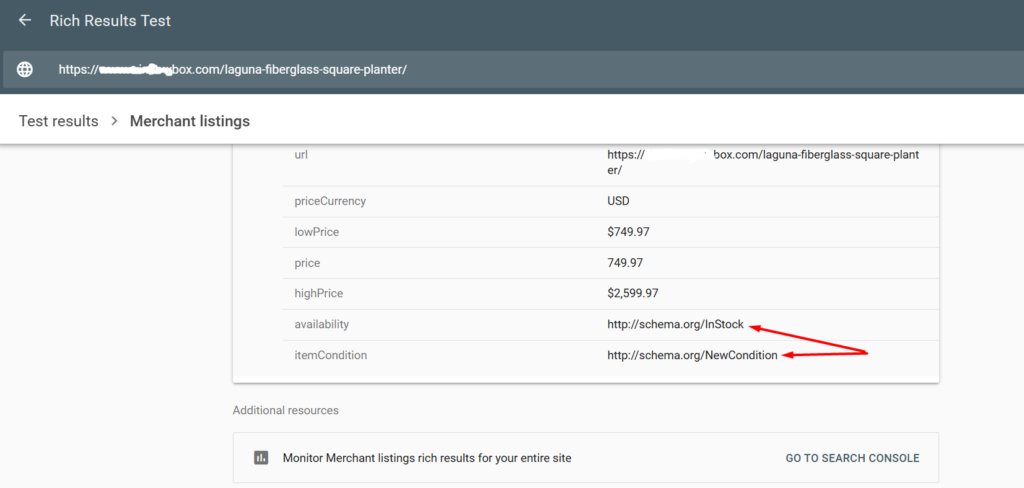
This inconsistency triggered disapprovals in the Merchant Center for most products. Compounding the problem, the site’s keyword portfolio leaned heavily on weather-dependent terms, leaving it vulnerable to seasonal demand drops.
Task:
I was tasked with:
- Resolving the product availability mismatch to restore Merchant Center eligibility for custom products.
- Expanding keyword coverage to include stable, year-round search terms.
- Leveraging technical and Generative engine optimization to capture more visibility across general search, map packs, and geo-intent queries — compensating for seasonal Shopping tab volatility.
Action
I executed a comprehensive technical and local SEO strategy, including:
- Keyword & Page Type Expansion:
- Created Industry and Use Case pages targeting stable B2B queries (e.g., “planters for commercial buildings”).
- Applied keyword-rich naming conventions to existing collection pages.
- On-Page SEO Enhancements:
- Encased all product names in heading tags, especially for collection page listings.
- Bolded key commercial and informational keywords sitewide to strengthen relevance signals.
- Technical SEO & Crawl Optimization:
- Reduced raw vs. rendered HTML discrepancies to improve render ratio and crawl efficacy.
- Created
llms.txtto enable generative engines to reference site content during inference without full-page rendering. - Modified
robots.txtto improve accessibility for LLM crawlers and inclusion in training datasets. - Reduced site “diameter” — the maximum click depth between indexable pages — to strengthen internal link equity.
- Off-Site Barnacle SEO:
- Established branded product listings and backlinks via Pinterest, Reddit, Listium, and Quora to gain additional SERP real estate.
- Merchant Center & Schema Fix:
- Updated structured data to reflect “preorder” status for custom products, aligning with product page messaging and feed data.
- Eliminated the availability mismatch, restoring Merchant Center eligibility.
Result
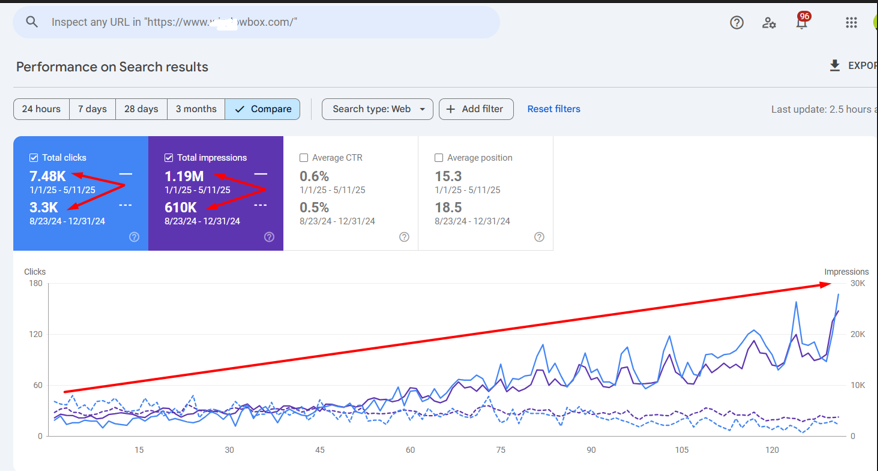
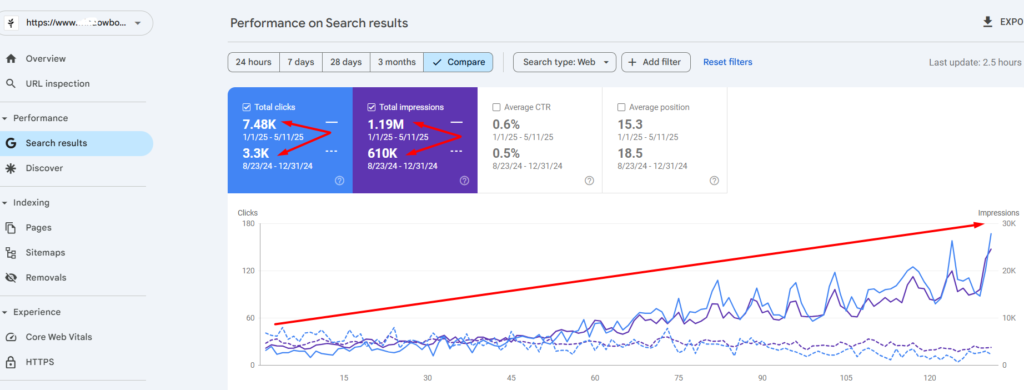
Within four months (Jan–Apr 2025 vs. Aug–Dec 2024):
- Organic Clicks: Increased from 3.3K to 7.48K (+126%).
- Organic Impressions: Increased from 610K to 1.19M (+95%).
- Merchant Center Recovery: The Majority of custom products reinstated for free listings and Shopping Ads, driving a measurable spike in Shopping impressions and clicks.
- Keyword Stability: New B2B and local-intent keyword rankings reduced reliance on seasonal search trends.
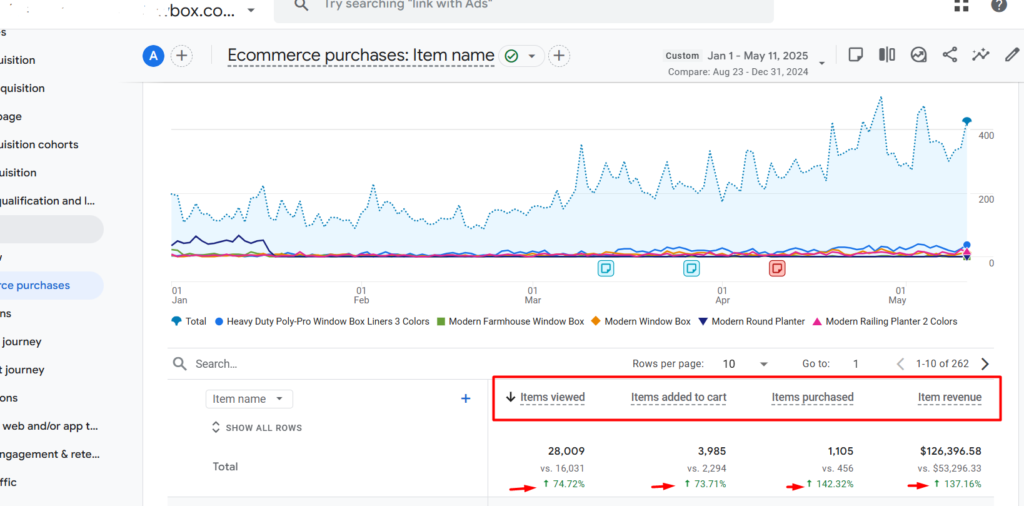
Revenue Impact
- Items Viewed Grew By +74.72% (28,009 vs. 16,031)
- Items Added to Cart Rose By +73.71% (3,985 vs. 2,294)
- Items Purchased Inclined By +142.32% (1,105 vs. 456)
- Item Revenue Improved By +137.16% ($126,396.58 vs. $53,296.33)